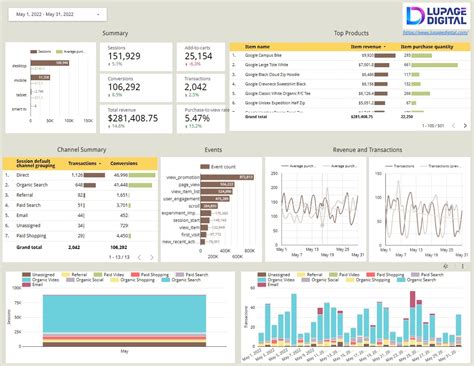
Google Analytics 4 (GA4) is a powerful tool for tracking website and app data, but to truly unlock its potential, you need to visualize your data in a meaningful way. That's where Google Data Studio comes in. With a well-designed GA4 Data Studio template, you can turn your data into actionable insights that drive business decisions. In this article, we'll explore the importance of using a GA4 Data Studio template, its benefits, and provide a comprehensive guide on how to create your own template for actionable insights.
Why Use a GA4 Data Studio Template?
A GA4 Data Studio template is a pre-designed report that connects to your GA4 property and visualizes your data in a way that's easy to understand. Using a template offers several benefits, including:
- Faster insights: With a pre-designed template, you can quickly connect to your GA4 data and start exploring your metrics without having to build a report from scratch.
- Improved analysis: A well-designed template helps you focus on the most important metrics and dimensions, ensuring you don't miss critical insights.
- Enhanced storytelling: Visualizations and charts in a template make it easier to communicate complex data insights to stakeholders, helping you tell a more compelling story.
Benefits of a GA4 Data Studio Template
A GA4 Data Studio template offers numerous benefits, including:
- Customizable: Templates can be tailored to fit your specific business needs and goals.
- Scalable: As your business grows, your template can be easily modified to accommodate new data sources and metrics.
- Collaboration: Templates can be shared with team members and stakeholders, ensuring everyone is on the same page.
- Cost-effective: Using a template saves time and resources compared to building a custom report from scratch.
Creating a GA4 Data Studio Template for Actionable Insights
To create a GA4 Data Studio template that provides actionable insights, follow these steps:
Step 1: Define Your Goals and Objectives
Before building your template, identify the key performance indicators (KPIs) and metrics that align with your business goals. Consider the following:
- Website traffic: Track visitors, page views, bounce rate, and average session duration.
- Conversion rates: Monitor goal completions, e-commerce transactions, and revenue.
- Audience insights: Analyze demographics, interests, and behavior.
Step 2: Connect to Your GA4 Property
Link your GA4 property to Data Studio by following these steps:
- Go to the Data Studio website and sign in with your Google account.
- Click on "Create a new report" and select "Google Analytics 4" as the data source.
- Enter your GA4 property ID and select the desired view.
- Click "Connect" to authorize the connection.
Example Image:

Step 3: Design Your Template
Use the following sections to create a comprehensive template:
- Overview: Display key metrics, such as website traffic, conversion rates, and revenue.
- Audience: Analyze demographics, interests, and behavior.
- Acquisition: Track website traffic sources, including organic, paid, and social media.
- Behavior: Examine page views, bounce rate, and average session duration.
- Conversion: Monitor goal completions, e-commerce transactions, and revenue.
Example Image:

Step 4: Add Visualizations and Charts
Use a variety of visualizations and charts to make your data more engaging and easier to understand. Some popular options include:
- Bar charts: Compare metrics across different dimensions, such as website traffic by source.
- Line charts: Show trends over time, such as conversion rates by month.
- Pie charts: Display distribution of metrics, such as audience demographics.
- Tables: Provide detailed data, such as top-performing pages or products.
Example Image:

Step 5: Filter and Segment Your Data
Use filters and segments to narrow down your data and gain more specific insights. For example:
- Filter by date range: Analyze data for a specific time period, such as last quarter.
- Segment by audience: Examine data for a specific audience, such as users from a particular country.
Example Image:

Gallery of GA4 Data Studio Template Examples


Frequently Asked Questions
What is a GA4 Data Studio template?
+A GA4 Data Studio template is a pre-designed report that connects to your GA4 property and visualizes your data in a way that's easy to understand.
How do I create a GA4 Data Studio template?
+To create a GA4 Data Studio template, define your goals and objectives, connect to your GA4 property, design your template, add visualizations and charts, and filter and segment your data.
What are the benefits of using a GA4 Data Studio template?
+The benefits of using a GA4 Data Studio template include faster insights, improved analysis, enhanced storytelling, customizability, scalability, collaboration, and cost-effectiveness.
By following these steps and tips, you can create a GA4 Data Studio template that provides actionable insights and helps you make data-driven decisions. Remember to customize your template to fit your specific business needs and goals, and don't hesitate to reach out if you have any further questions or need additional guidance.
